TM-FLOW / CHRONIC CARE SYSTEM (CCS) CLOUD PLATFORM
VASCULAR FUNCTION AND AUTONOMIC NERVOUS SYSTEM DATA MANAGEMENT
The New version 7 of the TM-Flow uses the CCS Cloud to build effective teamwork between the performing physician and qualified interpreting physician (e.g., specialists). It is a must in today’s healthcare environment due to increasing patient comorbidities and the complexity of specialization care required
The TM-Flow comprises:
Part 1: Three Devices
The TBL-ABI is:
A medical device indicated for use on adult subjects at risk of having or developing peripheral arterial disease (PAD)
Is intended for the rapid measurement of ankle-brachial pressure index (ABPI), or ankle-brachial index (ABI), and pulse volume recording (PVR)/ volume plethysmography in adults.`
A medical device indicated for use on adult subjects at risk of having or developing peripheral arterial disease (PAD)
Is intended for the rapid measurement of ankle-brachial pressure index (ABPI), or ankle-brachial index (ABI), and pulse volume recording (PVR)/ volume plethysmography in adults.`
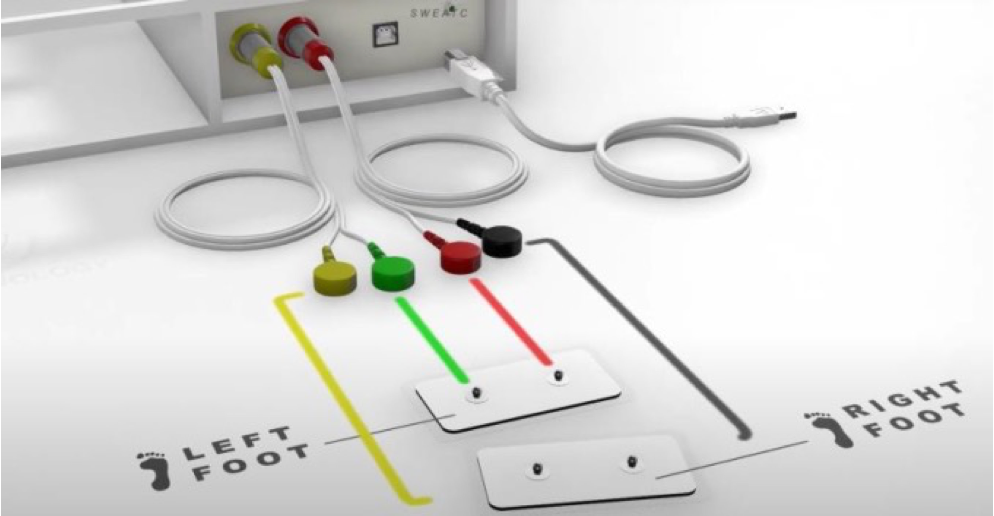
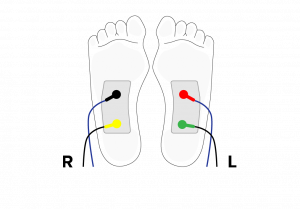
A medical device indicated for use as a galvanic skin response technology related to the sweat gland function. It is used to test the sudomotor function.
Sudomotor testing using this method “may be the most sensitive means to detect peripheral small fiber neuropathy (Low, et al.,2006).
A medical device indicated for use as a galvanic skin response technology related to the sweat gland function. It is used to test the sudomotor function.
Sudomotor testing using this method “may be the most sensitive means to detect peripheral small fiber neuropathy (Low, et al.,2006).
Register the physician and its partners through a web site (www.ldteckcloud.com).
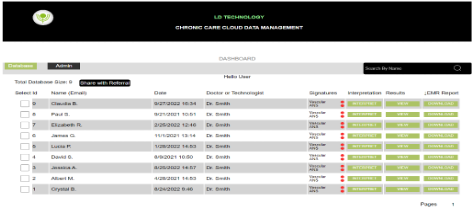
CCS Cloud data management
Provides access to the patient report and sharing with:
An Interpreting physician.
A Billing department
Displays a final patient report, with a full interpretation, that is available to the ordering physician. It can be printed or sent to an EMR.
Why TM-Flow/CCS Cloud Platform?
The 3 medical devices (TBL ABI, OXI W, SweatC) are used by physicians to assess patients who have suffered from complications of chronic diseases.
The devices allow for the early detection of chronic disease complications.
If there is no early diagnostic then there is no timely treatment, and time is of the essence when considering treatment for chronic disease complications.
Peer reviews and clinical studies demonstrate that chronic diseases, as well as their treatments, affect both vascular (endothelial function and Lower extremity artery) and autonomic nervous system (ANS) function (sudomotor and cardiac autonomic function).
After each device is used and the measurements are recorded, the software then sends the data to the CCS cloud. The online and secure cloud software allows the invited qualified physicians (neurologist, cardiologist, or vascular specialist), and also billing experts, to provide an interpretation and guidance regarding the device test results related to vascular or ANS functions and billing.
What is the Vision of the TM Flow/CCS Cloud Platform
Collaborating as a team to improve patient care.
Effective teamwork between the performing physician and qualified interpreting physician (e.g., specialists) is a must in today’s healthcare environment due to increasing patient comorbidities and the complexity of specialization care required.
The CCS cloud data management platform enables the formation of effective teamwork by helping align primary and specialty care physicians to deliver better patient care.
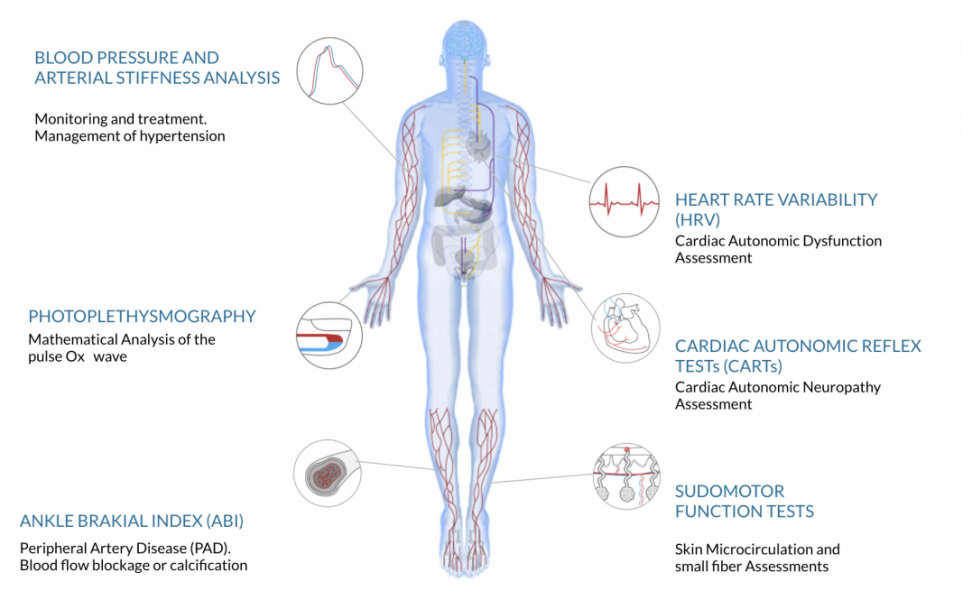
CCS ASSESMENTS
BLOOD PRESSURE AND ARTERIAL STIFFNESS ANALYSIS
Monitoring and treatment. Management of hypertension
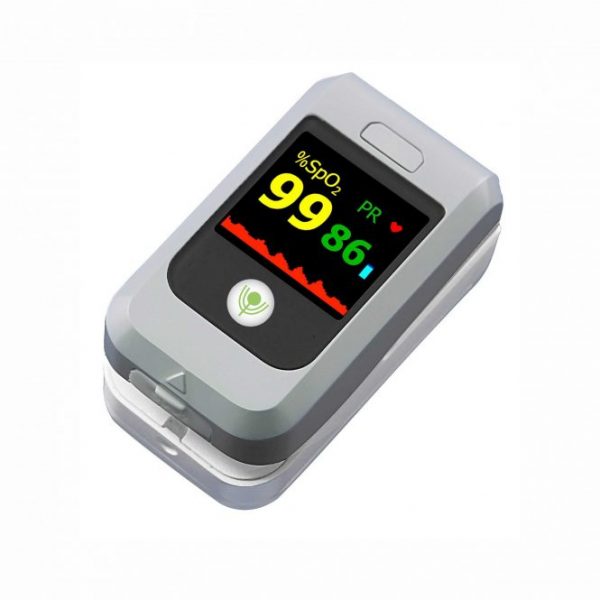
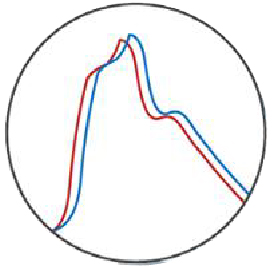
PHOTOPLETHYSMOGRAPHY
Mathematical Analysis of the pulse Ox wave
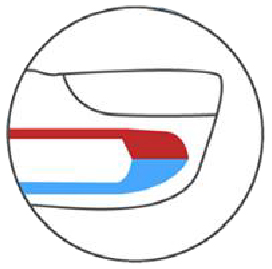
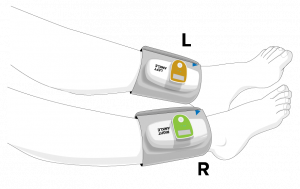
ANKLE BRAKIAL INDEX (ABI)
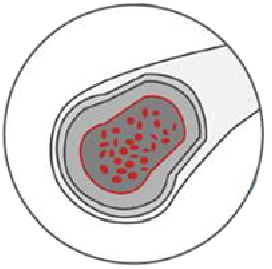
Peripheral Artery Disease (PAD). Blood flow blockage or calcification
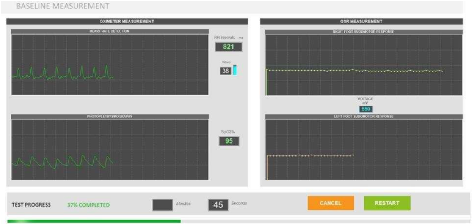
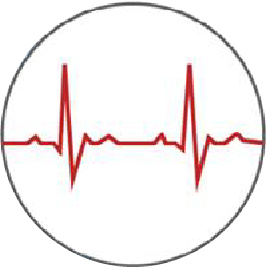
HEART RATE VARIABILITY (HRV)
Cardiac Autonomic Dysfunction Assessment
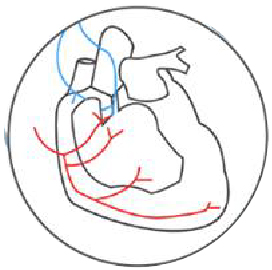
CARDIAC AUTOMATIC REFLEX TESTs (CARTs)
Cardiac Autonomic Neuropathy assessment
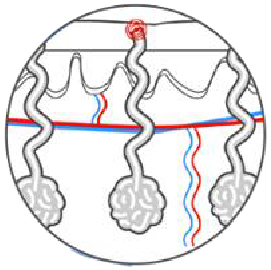
SUDOMOTOR FUNCTION TESTS
Skin Microcirculation and small fiber Assessments
TM-FLOW/CCS PLATFORM ASSESMENTS
MAIN SYMPTOMS OF AUTONOMIC NEUROPATHY AND VASCULAR DYSFUNCTION
MAIN SYMPTOMS OF AUTONOMIC NEUROPATHY AND VASCULAR DYSFUNCTION
FATIGUE
HEADACHE
DIZZINESS
EXERCISE INTOLERANCE
PAINFUL MUSCLE CRAMPING
FAINTING
TINGLING IN THE TOES OR FINGERS
CLAUDICATION
THIGHS OR CALVES WHEN WALKING
CLIMBING STAIRS OR EXERCING
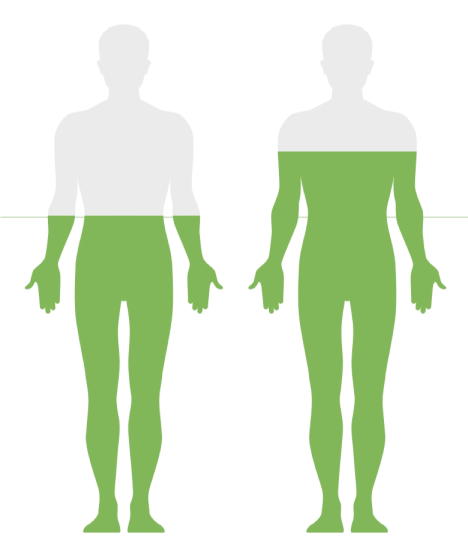
USA POPULATION THAT SHOULD BE TESTED BY LD TECHNOLOGY PRODUCTS
50+
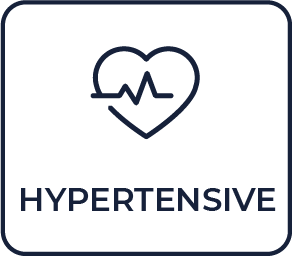
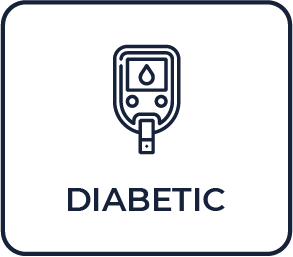
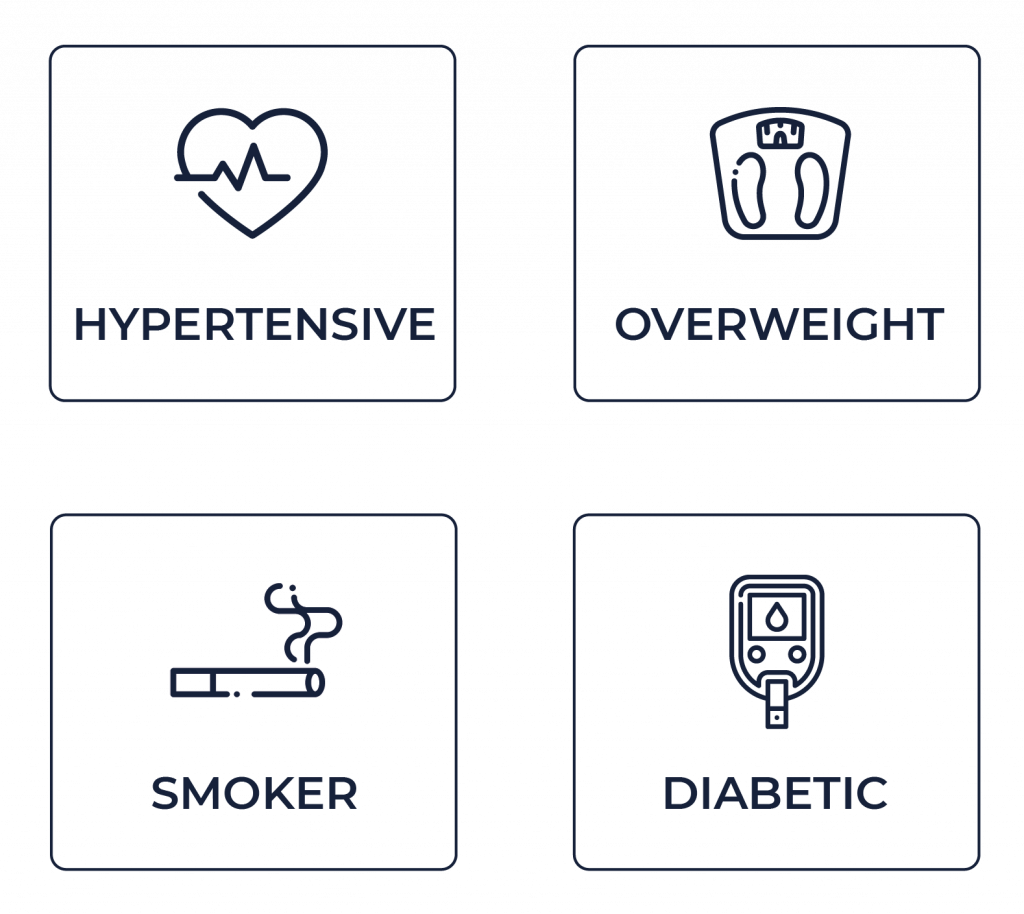
Population over 50 years old with cardiovascular risk factors (Hypertensive, Overweight, Smoker, Diabetic)
70+
Population over 70 years old.
USA POPULATION THAT SHOULD BE TESTED BY LD TECHNOLOGY PRODUCTS
USA POPULATION THAT SHOULD BE TESTED BY LD TECHNOLOGY PRODUCTS
50+
Population over 50 years old with cardiovascular risk factors (Hypertensive, Overweight, Smoker, Diabetic)
70+
Population over 70 years old.
MAIN MARKERS
VASCULAR FUNCTION ASSESSMENT
VASCULAR FUNCTION ASSESSMENT
Arterial stiffness and Ankle Brachial Indices from the Volume plethysmography analysis.
Endothelial FunctionPatented markers from mathematical analysis of the photoplethysmography spectral analysis. (Off label use).
AUTONOMIC NERVOUS SYSTEM ASSESSMENT
AUTONOMIC NERVOUS SYSTEM ASSESSMENT
Sudomotor Function Markers.
Heart rate variability Analysis (HRV).
Cardiac Autonomic Reflex Tests: - Valsalva Ratio, - E/I Ratio , - K30/15 Ratio and - Systolic Pressure Response to Standing.
The ROC curves showed that the most relevant cutoff to the whole study group was a PTG-TP > 406.2. This cut-off had a sensitivity = 95.7%, specificity = 84,4% and the area under the ROC curve (AUC) = 0.929 for identifying insulin resistance. All AUC ROC curve analysis were significant (p < 0.0001).
the PTG CVD score had a sensitivity of 82.5% and specificity of 96.8%, at a cutoff of 2, when used to detect CAD (P=0.0001; area under the receiver operating characteristic curve =0.967). The PTG spectral analysis markers were well-correlated to other autonomic nervous system and endothelial function markers. CAD diabetic patients (n=27) had a lower PTGi value compared with the CAD non-diabetic patients (n=38): and patients that underwent CABG (n=18) had a higher PTGi value compared with the CAD without CABG surgery patients (n=47).
Comparisons between the healthy subjects and type 2 diabetes mellitus patients
The PTGi had a sensitivity of 92% and specificity of 80% (cut-off score > 35.5) with the area under the curve = 0.92 (SE = 0.04; 95% CI = 0.84, 1.0) and an asymptotic significance < 0.001. The PTGVLFi had a sensitivity of 92% and specificity of 87% (cut-off score > 25.5) with the area under the curve = 0.91 (SE = 0.05; 95% CI = 0.81, 1.0) and an asymptotic significance < 0.001.
Stress Index marker correlated with CRP (ρ = −0.38, p < 0.0001 and PTG VLFi correlated with fibrinogen (ρ = 0.43, p < 0.0001).
HRV Total Power (TP)
was also significantly different between groups, with vitamin D insufficient individuals having lower TP values compared to vitamin D sufficient participants (P = 0.045)
had a sensitivity of 88% and a specificity of 68% (Area Under the Curve = 0.81, p < 0.0001) to detect retinopathy. The NO Sweat Peak response marker inversely correlated with BUN (ρ = −0.41, p < 0.0001), homocysteine (ρ = −0.44, p < 0.0001), fibrinogen (ρ = −0.41, p < 0.0001), the Cardiac Autonomic Neuropathy score (ρ = −0.68, p < 0.0001), and the heart rate variability Total Power (ρ = −0.57, p < 0.0001)
TBL-ABI Clinical study
Overall ABI sensitivity and specificity
The overall ABI gave the same specificity and sensitivity values of 77.8%, with a cutoff ≤ 0.9 (P = 0.024 and AUC = 0.747) for detecting vascular color Doppler ultrasound biphasic and monophasic waveforms versus triphasic waveforms.
Overall TBI sensitivity and specificity
The overall TBI gave a specificity of 55.6% and sensitivity of 100%, with a cutoff ≤ 0.55. (P = 0.001 and AUC = 0.824) for detecting vascular color Doppler ultrasound biphasic and monophasic waveforms versus triphasic waveforms.
Overall PTG Index marker sensitivity and specificity
The overall PTG index marker gave a specificity of 83.3% and a sensitivity of 100%, with a cutoff ≤ 26 (P = 0.001 and AUC = 0.917) for detecting vascular color Doppler ultrasound biphasic and monophasic waveforms versus triphasic waveforms
The overall sum the ABI and TBI (SBI) values gave a specificity of 88.9% and a sensitivity of 100% with a cutoff ≤ 1.36 (P = 0.001 and AUC = 0.960) for detecting vascular color Doppler ultrasound biphasic and monophasic waveforms versus triphasic waveforms
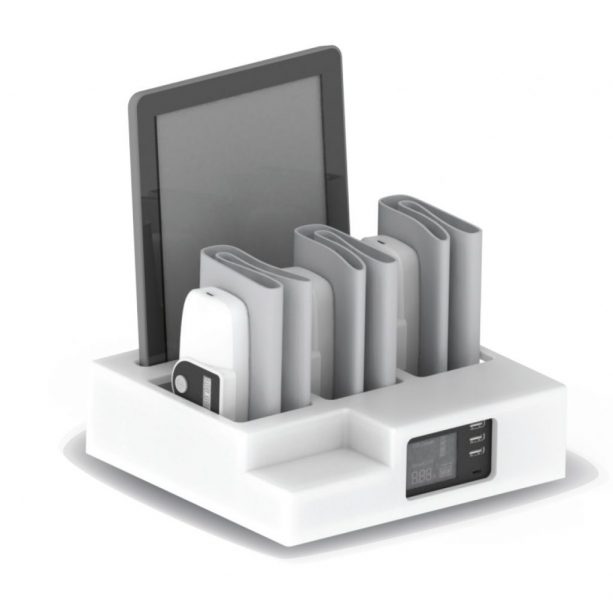
HARDWARE COMPONENTS
This video animation shows you the full components of the SweatC, OXI_W and TBL-ABI systems.
It will help the user to properly setup the hardware and how to charge the wireless devices.